Research by Elavon shows where consumers prefer to shop, with the data showing that the high street is not dead, just different.
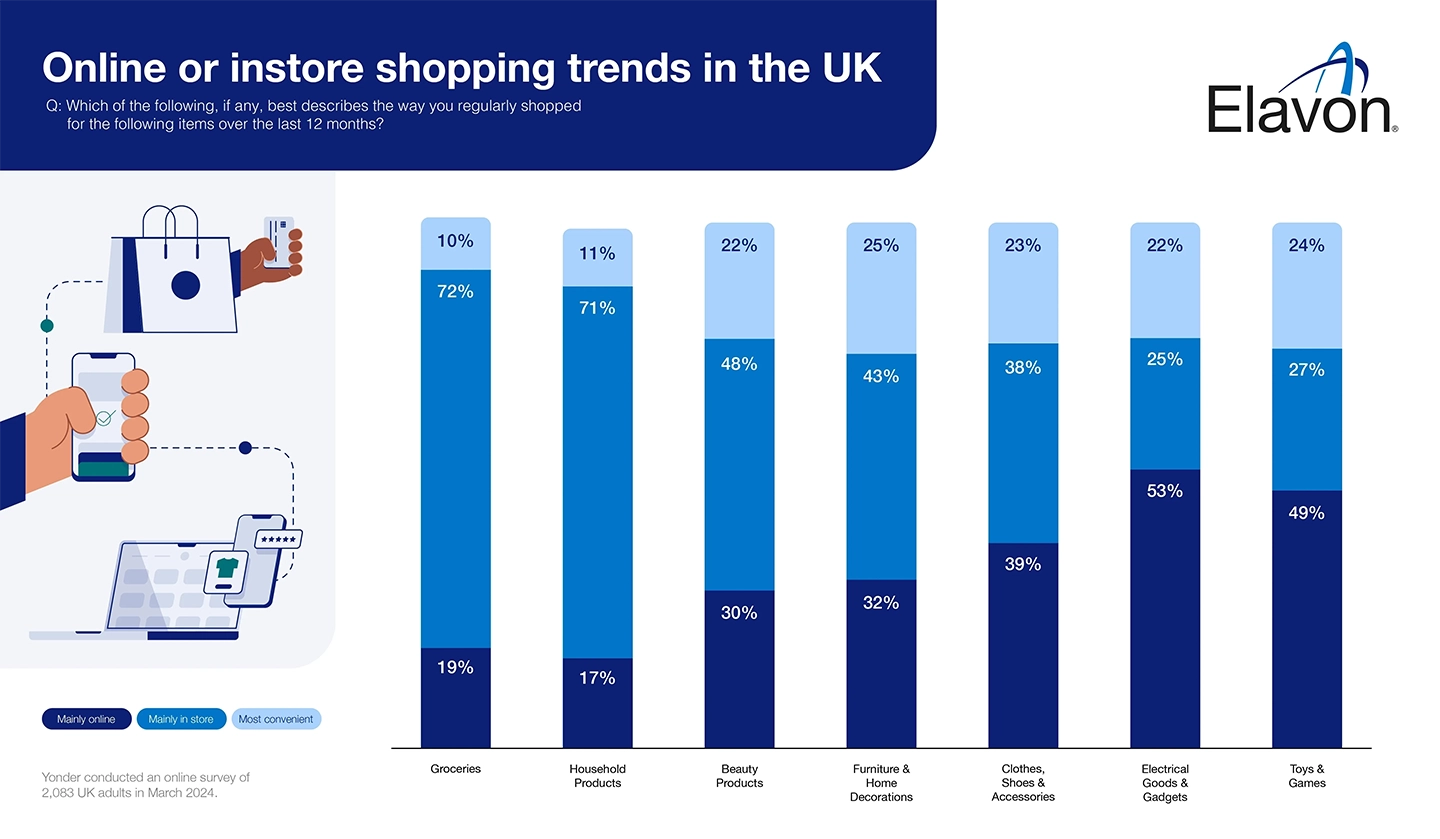
In an online survey of more than 2,000 adults in the UK, people were asked where they did most of their shopping for groceries; household products; clothes, shoes and accessories; beauty products; furniture and home decorations; electrical goods and gadgets; and toys and games.
The results show that for those who shop for groceries, household products, beauty, and furniture, they prefer to do so in-store.
Meanwhile, clothes, electrical goods and games, are mainly bought online, by those who shop for those items.
The results broadly reflect the same survey carried out by Yonder on behalf of Elavon last year, suggesting these shopping habits are here to stay.
“While there was a move from the high street to online shopping in recent years, accelerated by the 2020 Covid pandemic, these results show the high street is not dead, just different,” says Scott Frisby, Head of Strategy at Elavon Europe.
“But it also shows that it is important for businesses to diversify, to offer different ways to pay, either in person at a shop, or online. Offering both these is known as omnicommerce.
“We can see that the supermarket shop, including independent food shops, remains the primary way people buy their groceries and household products, such as washing up liquid.
“Similarly, there is a strong showing for in-store for items which shoppers want to see such as furniture, beauty products and clothes.”
This idea reflects separate research by Elavon which revealed the primary reason people visit a shop is to see an item in person. This might be to try on clothes or sit on a settee.
Multicommerce
Another arresting piece of data highlights the importance of convenience to the consumer.
For all the categories barring groceries and household products, this option was important to more than a fifth of all respondents.
“Here we see consumers just going with the easiest place to buy. Here’s an opportunity for you, the retailer, to give yourself an edge over your competitors,” says Frisby.
“Make sure you offer different ways to pay, and make it a smooth, seamless process. This might be offering a self-checkout kiosk, self-scan and pay, paying at a traditional till, or a combination of those different methods.
“It might involve what we call de-coupling of the payment process from the delivery of service, where customers order their items and pay for it, freeing up your staff from the administrative process of payment.
“This is frequently already available in larger chains, but we see no reason why it won’t increasingly be taken up in smaller businesses, in both retail and hospitality.”
The data in greater depth
If you take a closer look at the survey results, the data also reveals some interesting stories.
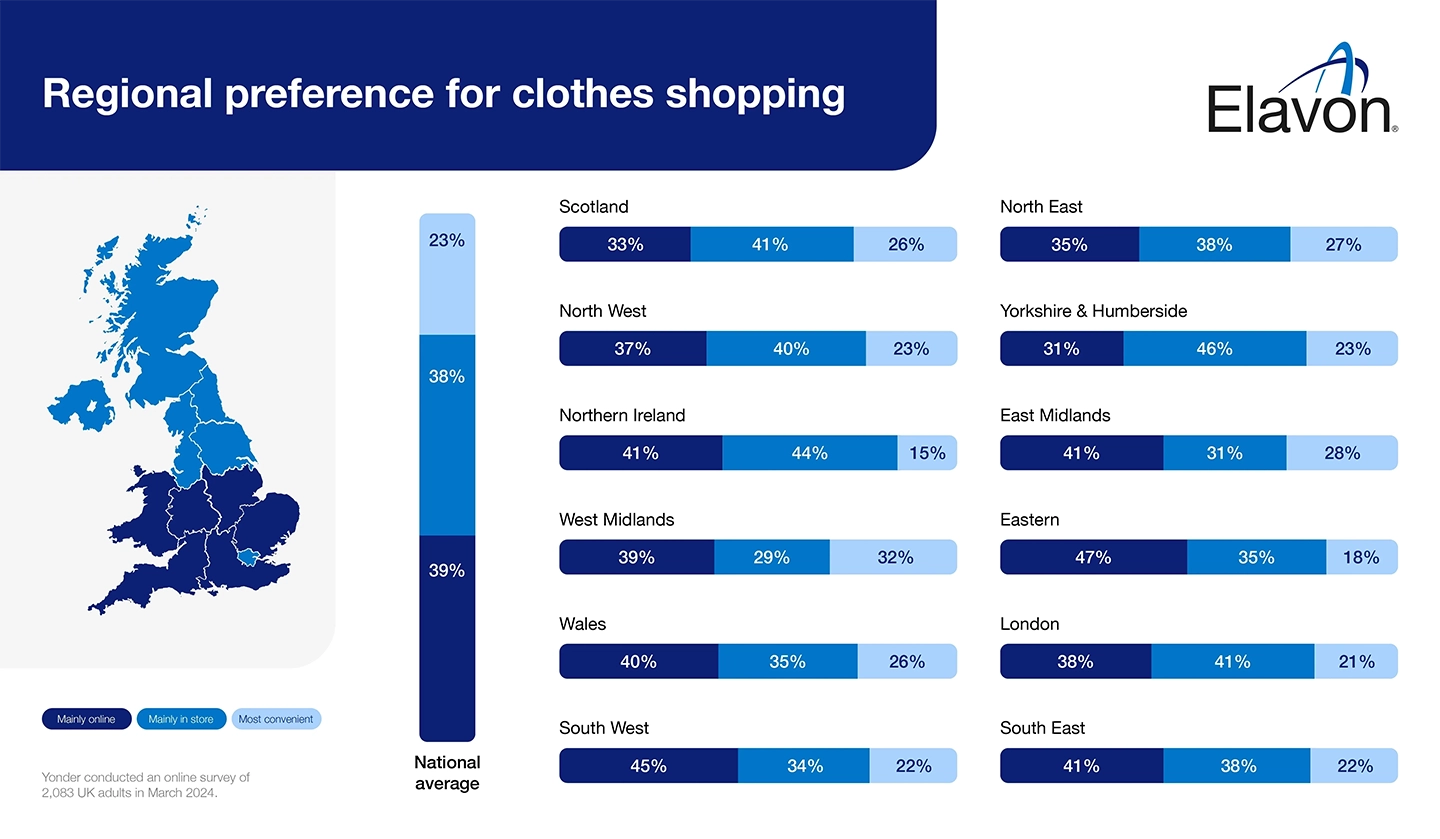
There appears to be a north-south divide in the UK, with those in Scotland and the north of England more likely to shop in-store than those in Wales, the midlands and the south.
This is particularly noticeable for clothes, shoes and accessories. Nationally, there’s a slight preference (39%) for online shopping over in-store (38%).
But in Scotland, Northern Ireland and the north of England, shoppers prefer to visit a store rather than buy online, while those in Wales and the south of England favour online over in-store. London is the exception, with a slight preference for in-store shopping for clothes and shoes.
Meanwhile, the data suggests that the older a person is the more likely they are to visit a shop and vice versa but the general trends remain the same regardless of age.
“Our data shows that shoppers like choice,” says Frisby. “As a retailer, you need to understand your customer and how they want to buy.
“Choose a payments provider that help guide you through the many different options available so you’re not unnecessarily putting off custom.”
Elavon provides a one-stop shop for online and in-person payment solutions. Talk to us to find out more.
Source: Yonder conducted an online sample of 2,083 UK adults 18+ between 6 – 7 March 2024. Data is weighted to be representative of the population of the UK. Targets for quotas and weights are taken from the PAMCO survey, a random probability survey conducted annually with 35,000 adults. Yonder is a founding member of the British Polling Council and abides by its rules.
|
|
Groceries |
Clothes, shoes and accessories |
Household products (e.g. cleaning products, laundry products, bin liners, kitchen towels) |
Furniture & home decorations |
Beauty products |
Electrical goods and gadgets |
Toys and games |
|---|---|---|---|---|---|---|---|
|
Base |
2083 |
2083 |
2083 |
2083 |
2083 |
2083 |
2083 |
|
I shopped mainly online for this |
18% |
38% |
17% |
25% |
23% |
48% |
26% |
|
I shopped mainly in store for this |
71% |
36% |
70% |
34% |
36% |
22% |
15% |
|
I shopped wherever is convenient for this |
9% |
23% |
11% |
20% |
16% |
20% |
13% |
|
Not applicable to me |
1% |
3% |
2% |
22% |
25% |
10% |
46% |
Base
Groceries
2083
Clothes, shoes and accessories
2083
Household products (e.g. cleaning products, laundry products, bin liners, kitchen towels)
2083
Furniture & home decorations
2083
Beauty products
2083
Electrical goods and gadgets
2083
Toys and games
2083
I shopped mainly online for this
Groceries
18%
Clothes, shoes and accessories
38%
Household products (e.g. cleaning products, laundry products, bin liners, kitchen towels)
17%
Furniture & home decorations
25%
Beauty products
23%
Electrical goods and gadgets
48%
Toys and games
26%
I shopped mainly in store for this
Groceries
71%
Clothes, shoes and accessories
36%
Household products (e.g. cleaning products, laundry products, bin liners, kitchen towels)
70%
Furniture & home decorations
34%
Beauty products
36%
Electrical goods and gadgets
22%
Toys and games
15%
I shopped wherever is convenient for this
Groceries
9%
Clothes, shoes and accessories
23%
Household products (e.g. cleaning products, laundry products, bin liners, kitchen towels)
11%
Furniture & home decorations
20%
Beauty products
16%
Electrical goods and gadgets
20%
Toys and games
13%
Not applicable to me
Groceries
1%
Clothes, shoes and accessories
3%
Household products (e.g. cleaning products, laundry products, bin liners, kitchen towels)
2%
Furniture & home decorations
22%
Beauty products
25%
Electrical goods and gadgets
10%
Toys and games
46%


